Server Monitoring
AggreGate Network Manager provides a consolidated, comprehensive solution for monitoring your servers regardless of their hardware and platform.
Monitoring is performed using SNMP, WMI, Telnet/SSH, and other standard technologies. The following operating systems are supported out-of-the-box:
| Windows | FreeBSD | AIX |
| Linux/Unix | Solaris | HP-UX |
| Mac OS |

Server Discovery
The discovery process finds all servers in your network and auto-detects their type. All networked applications and services are discovered by the port scanning even if a server doesn't respond SNMP and even ping requests.
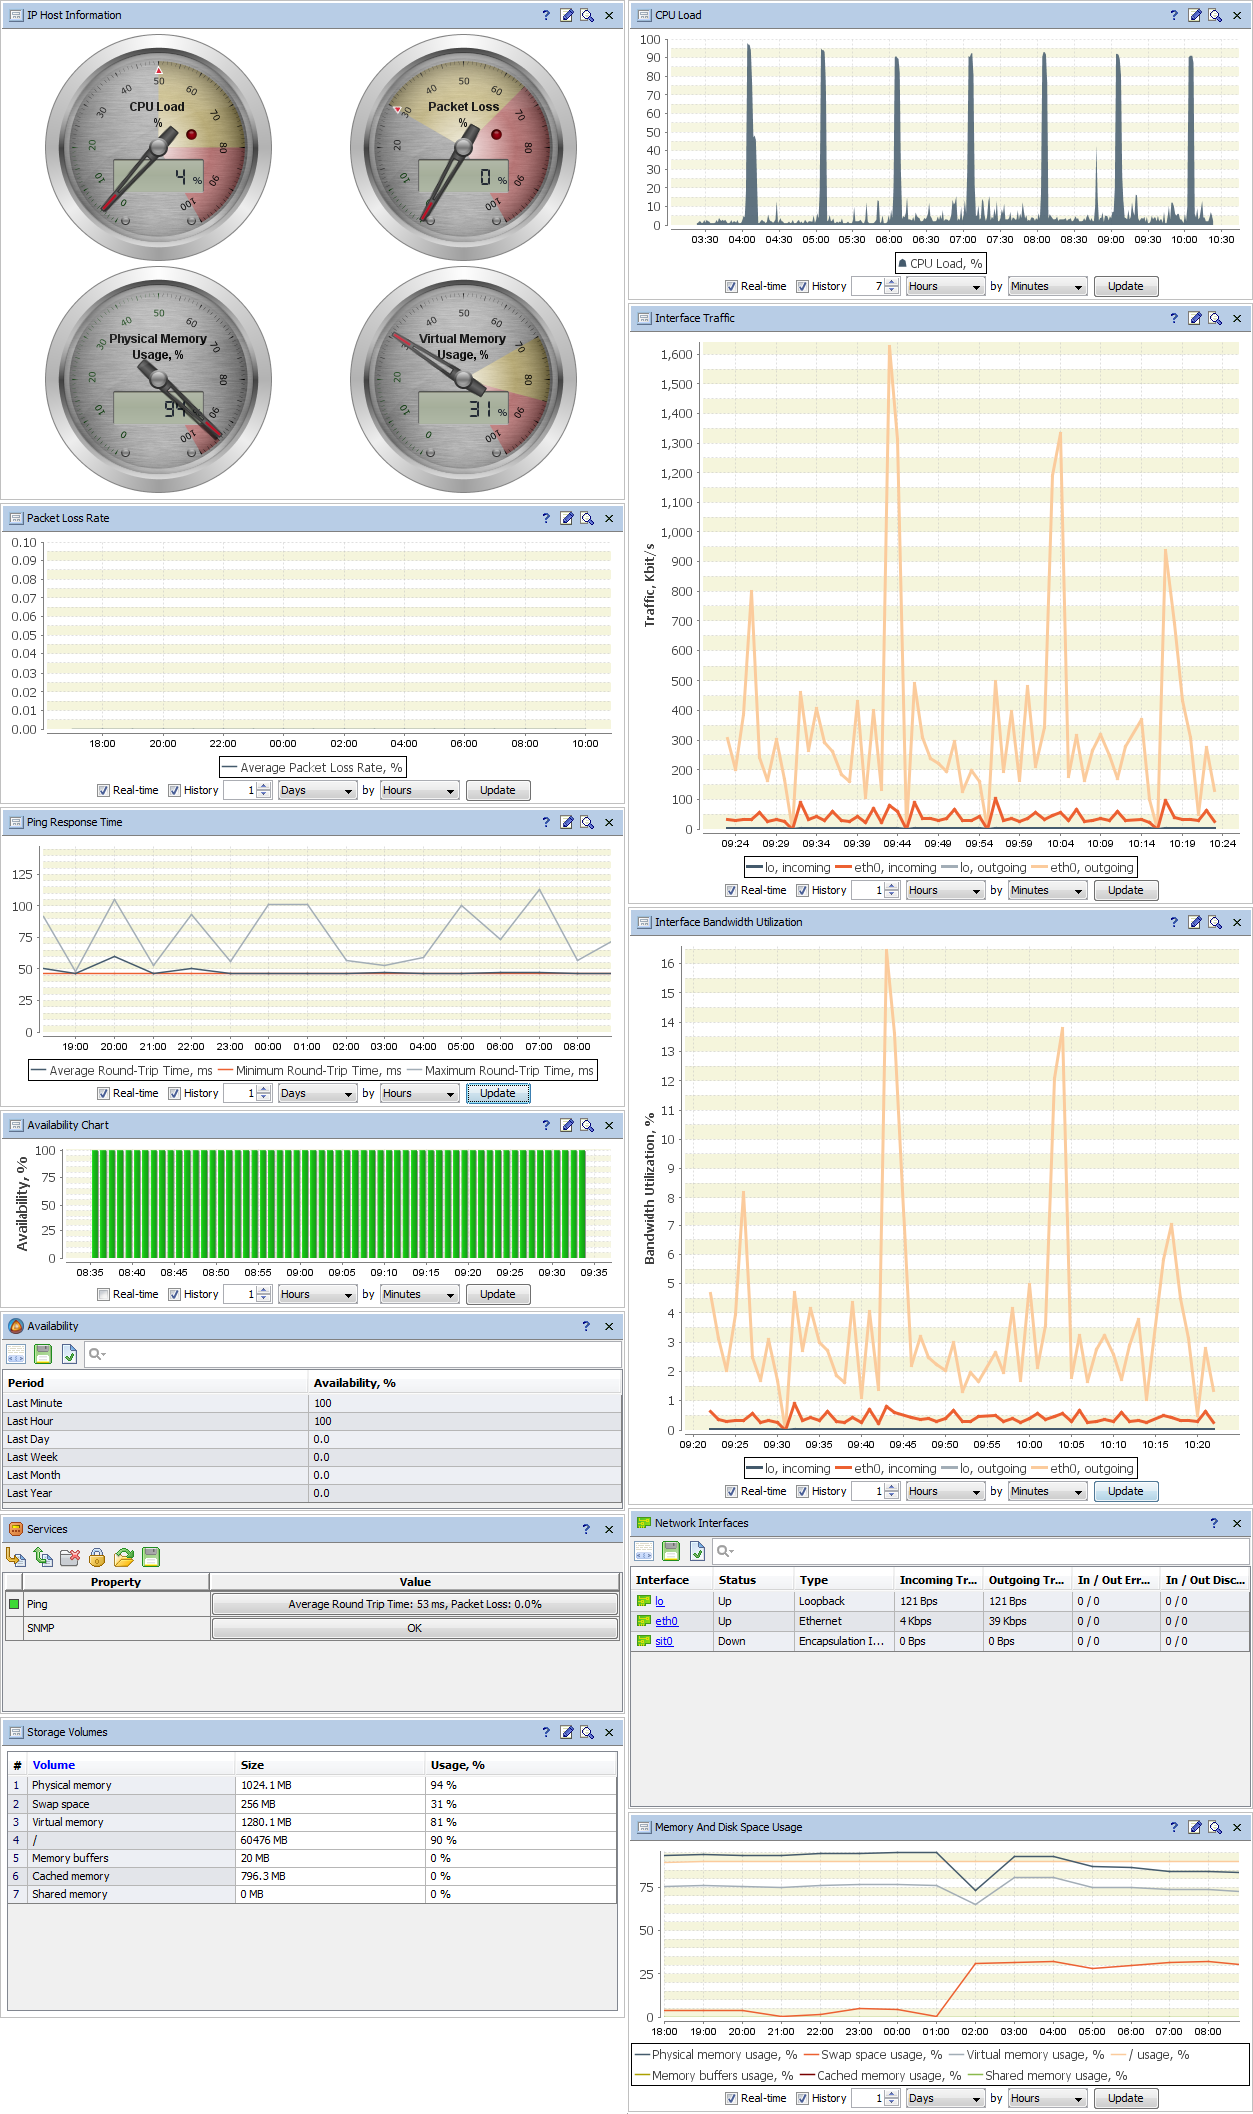
Server Performance and Health Monitoring
AggreGate Network Manager provides the alerting, charting, reporting, long-term history storage, and deep analysis options for all critical server health metrics:
| Availability |
| CPU load |
| Disk space usage |
| Traffic and bandwidth usage |
| Running processes and services |
| CPU/HDD/motherboard temperature |
| FAN speed and status |
| Any custom metrics available via SNMP |
Built-in alerts are provided for the important and critical server events, such as Authorization Failure, Superuser Login, Kernel Alert/Emergency, etc.
All alerts can be followed by the corrective actions, such as shell script execution or Wake-on-LAN.
An integrated task scheduler helps set up periodic emailing of daily, weekly or monthly reports to the system administrator or company executives.
Agentless Monitoring
AggreGate Network Manager monitors the network without any agents, so there is no additional software or hardware required to install on the target servers.
Application/Service Monitoring
Applications and services "known" by AggreGate Network Manager are monitored via the dedicated "smart" meters. This assumes checking the application operability instead of its availability.
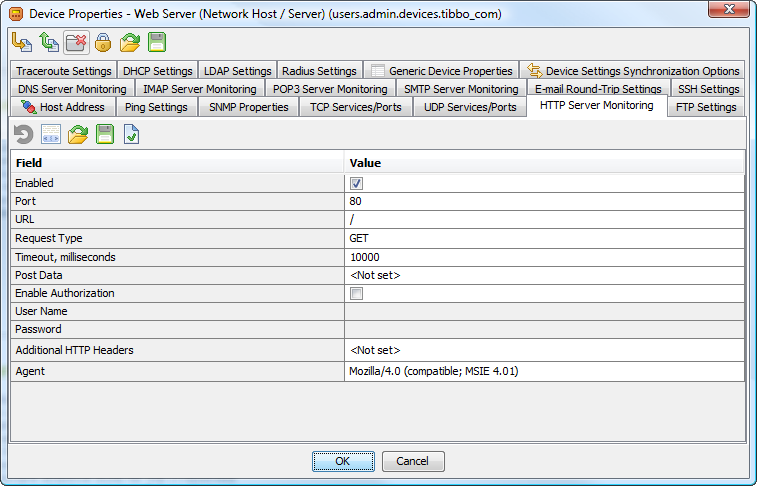
Most service-specific meters have a similar behavior:
| Connection to the application/service via its native protocol |
| Passing the authentication/authorization procedure |
| Retrieving the application state and key metrics |
| Sending some pre-defined requests |
| Caching the application reply within the system core for further analysis |
Windows Event Log and Syslog messages from the diverse applications are collected and stored in a database. These messages can also trigger the pre-built alerts, such as Mail Emergency, FTP Login, etc.
Generic TCP/UDP Service Monitoring
Operability of the unrecognized applications and services (both TCP and UDP) can be monitored by:
| Establishing a connection with a service (for TCP-based services) and checking the service availability |
| Sending some raw input data |
| Reading the raw output and injecting it into the system core for analysis |
| Measuring the response time and storing its stats |
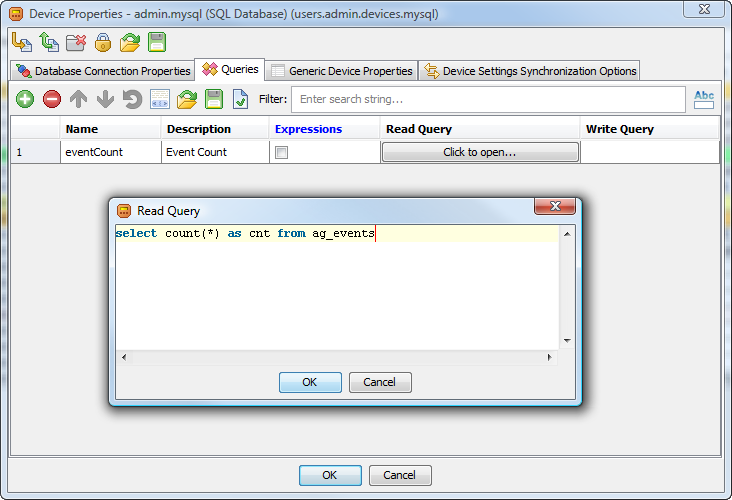
Database Monitoring
AggreGate Network Manager monitors the database servers via JDBC/ODBC. Virtually all modern enterprise databases are supported, including:
| Oracle |
| Microsoft SQL Server |
| MySQL |
| PostreSQL |
| Firebird |
The system is capable of executing dynamically constructed arbitrary SQL queries and converting the result sets into the AggreGate format to make them available for analysis. Dynamically constructed insert/update/delete queries can be also executed on-demand.

File/Folder Monitoring
File and folder periodic monitoring operations include:
| Checking the file/folder existence |
| Validating the file size, modification time and checksum |
| Verifying the number of files in a folder and their total size |
| Loading the file contents into the system and making it available for editing/analysis |
| Folder contents inspection |
Custom alerts may be triggered if the above operations lead to some unexpected results.
Remote Script Execution
AggreGate Network Manager can execute the custom shell scripts and applications on remote machines over a secure SSH connection to allow the acquisition of non-standard data and execution of different actions (e.g., rebooting the servers).
The scripts may be executed:
| Periodically, according to the custom schedule |
| Upon alerts |
| On-demand |
Physical and Virtual Infrastructure Monitoring
The system makes no difference between the physical and virtualized servers. Guest operating systems running under the VMWare ESX/ESXi servers provide the same metrics as their "real" counterparts.
Based on Linux, the VMWare servers can be also monitored like any other physical machines, providing the same set of performance indicators. However, the virtualized infrastructure monitoring and management involve a lot of dedicated tasks, e.g. starting, stopping or suspending the Guest VMs.