Windows Monitoring

AggreGate Network Manager enables comprehensive Windows servers monitoring and workstations monitoring operated by any version of Microsoft Windows.
Important monitoring objectives include:
- Ensuring high availability of a server machine and all services/applications
- Intelligent monitoring of applications operability
- Tracking OS and application performance metrics in real-time and analyzing them from the historical perspective
- Automatic maintenance of actual network inventory
- Capacity planning facilitation

WMI Monitoring Methods
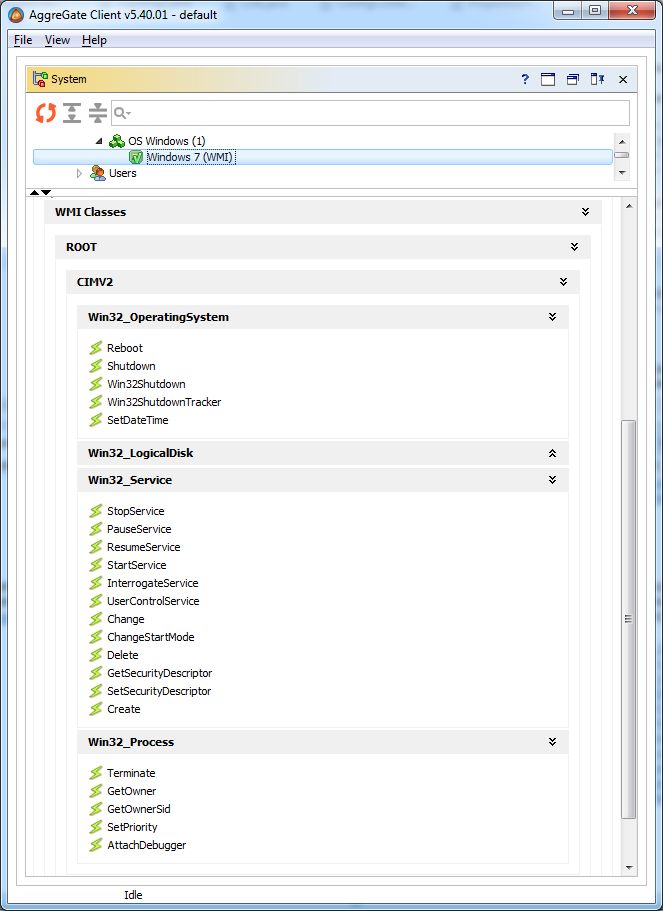
The list of OS and application metrics available for monitoring is huge. While the Windows SNMP Agent exposes just hundreds of them to the outside world, the Windows Management Instrumentation (WMI) protocol allows remotely "turning a Windows machine inside out", providing thousands of object types and millions of operability and performance metrics. Many other protocols can be also used for monitoring, e.g. the Manager's SMB/CIFS device driver allows checking existence, sizes, timestamps, and contents of files and folders shared within a Windows network.
Network Manager's unique WMI device driver allows accessing any WMI metrics by the remote execution of WQL queries even if a monitoring server runs under Linux or Mac OS.
Here are some typical Windows monitoring functions supported by AggreGate Network Manager:
| Detailed CPU load (overall, per-core, per-process, etc.) via SNMP or WMI | Network interface status, traffic, errors, and discards (via SNMP or WMI) |
| Disk space usage and other filesystem metrics (via SNMP or WMI) | Disk I/O performance (via SNMP or WMI) |
| Physical, virtual and swap memory usage (via SNMP or WMI) | Running processes and per-process memory/FD usage (via SNMP or WMI) |
| Windows event logs (via WMI) | Size, contents and timestamps of arbitrary files and folders (via SMB/CIFS or FTP) |
| All public services (HTTP, SMTP, IMAP, POP3, DNS, DHCP, etc.) via intelligent operability probes | Underlying hardware, e.g. temperatures, fan speed, RAID controllers or HDDs SMART status (via WMI or IPMI) |
| Available updates (via WMI monitor) | Generic TCP/UDP ports (by sending sample data and checking replies) |
| Widespread applications (Active Directory, Exchange, IIS, and many more) | Custom WMI performance counters |
| Terminal services (via WMI monitoring software) | .NET framework and applications based on it |
| System and process uptime | And more |
There is no need to manually add all Windows hosts in the network to the inventory. The Manager does this automatically during the network discovery process.
Windows Performance Monitoring and Data Analysis
The Network Manager as a Windows monitoring tool uses the modeling engine to convert SNMP and WMI metrics to a common format, allowing the unified approach for upper-level analysis and visualization, e.g. alerting, event filtering, reporting and network mapping. Bundled models measuring and processing OS performance metrics are fully compliant with all Windows versions making most features work out-of-the-box.