Network Monitoring and Management
AggreGate Network Manager enables the end-to-end monitoring and management of your network devices and services.
Network Discovery
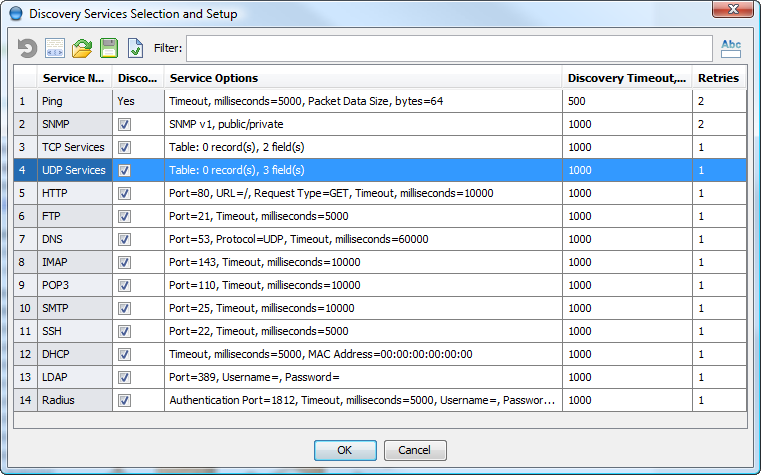
AggreGate Network Manager scans your network and discovers the routers, switches, workstations, servers, printers, and all other network equipment types. The discovery process detects applications and services running on the uncovered computers, and it can be scheduled for periodic execution.
Availability of network services is checked by authenticating/authorizing with the credentials stored in the centralized repository. AggreGate Network Manager can also detect custom applications and services listening on the user-defined ports.
The Manager performs a periodic detection of L1/L2/L3 network topology using ARP, STP, AFT, CDP, LLDP, and other technologies. All network links are stored in the server database and can be corrected manually. It's also possible to discover the topologies of other types, including SDH/PDH, MPLS, service topology, and others. The topology information can be retrieved from the lower-level Element Management Systems (EMS).
Discovery is performed using SNMP, ICMP, TCP port scanning, and other methods. The network topology is automatically analyzed by reading the interface/subnet tables from SNMP-enabled routers. However, it's possible to perform the scanning of manually specified subnets and IP ranges.
A discovery engine can create new device accounts and update the monitored services configuration for the existing accounts. A Re-discover Services action is available to obtain the up-to-date services information for a single host.
Dynamic Network Mapping
Advanced UI Builder integrated into the AggreGate IoT Platform helps to build dynamic network maps of any complexity:
- Static maps with raster or vector background images. Especially suitable for floor/facility plans.
- Topology maps showing the links between devices and their dynamic status. The topology maps support zooming, panning, rotation, node relocation, and more.
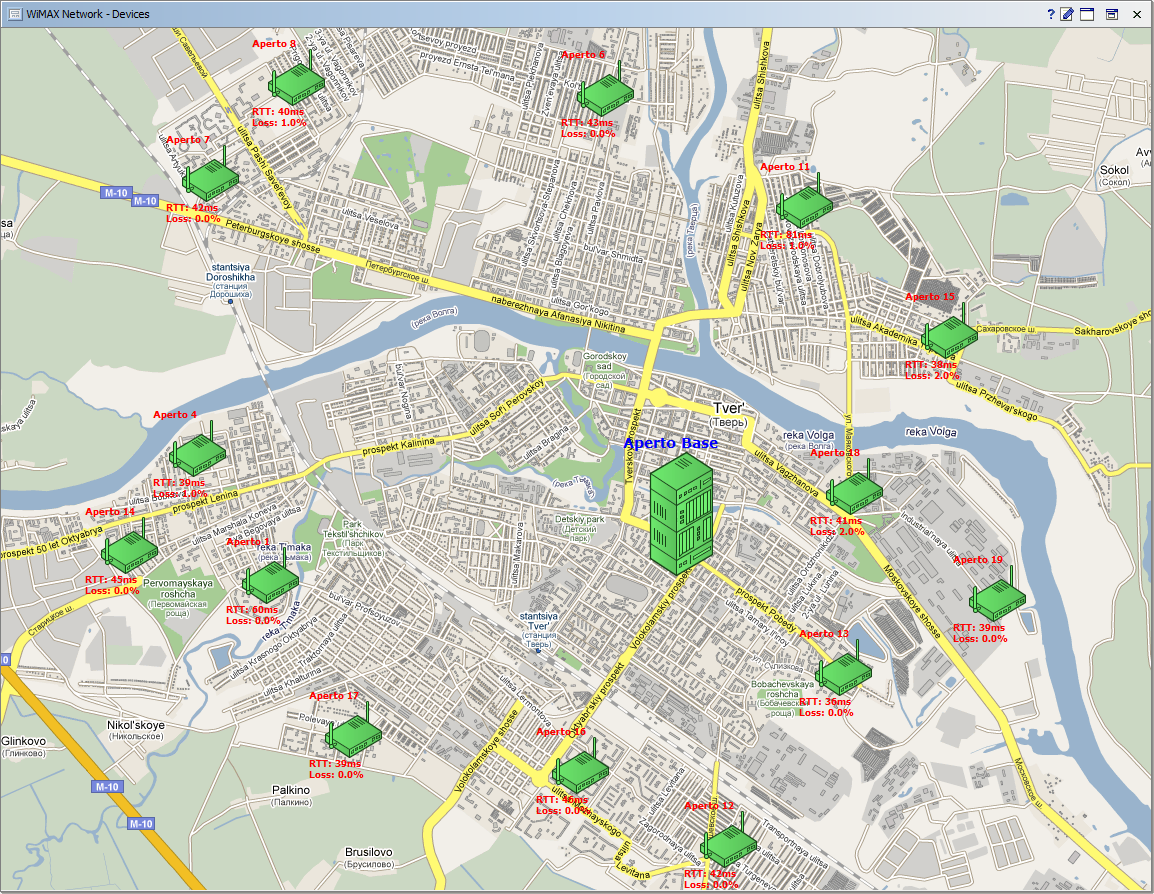
- Geographical maps based on Google Maps, Bing Maps, OpenStreetMap, or other GIS sources. These maps also support the topology visualization, i.e. dynamic device-to-device links.

Topological and geographical maps can render different types of network topology, including the L1/L2/L3 OSI model links, device parent-to-child relationship, internal manually filled topology database, external database table, and custom topology providers (MPLS, SDH, etc).
Network maps may contain:
| Color-coded and/or animated device icons indicating the device type and status |
| Valuable device/network information |
| Charts and event logs |
| Links and buttons opening the detailed submaps |
| Background images |
| Custom toolbars |
| Any other UI components |

Event Consolidation and Management
SNMP traps, Syslog messages and Windows Event Log events are converted into the system events and stored centrally. These events can be browsed in the Event Log, acknowledged, used for triggering alerts, etc. Real-time and historical events can be filtered, sorted and highlighted by the date, source, type, level, and custom expressions.
See the Event Management page for more information.
Advanced Alerting
Alerts can be triggered by any system event or state, for example, when an SNMP trap satisfying a certain condition is received or a monitored parameter of a server/router is out of range.

Every alert can have unlimited expression-based triggers. Alert notifications include pop-up windows, sound alarms, e-mail and SMS messages, and other methods.
The distribution package includes numerous configurable built-in alerts for typical network, server, application, and service problems (e.g., High Packet Loss Rate, Low Disk Space/Memory, etc.)
Unparalleled Flexibility
- Fine-Grained Polling, Caching and Trending. Polling period, update history storage time and many other options are configured individually for every monitored parameter. AggreGate Network Manager constantly polls all configured devices and caches their configuration in a server-side database for the quick access by other system facilities.
- Preconfigured Device Templates. Recommended set of monitored parameters and polling intervals is set up automatically for every new device.
- Reporting. Advanced reporting engine, built-in report editor, report printing and exporting in different formats. Automatic report generation from any viewed/edited data. Scheduled report emailing. Built-in reports for availability, response time, CPU load, disk usage, traffic statistics, and more.
- Charting. Support for a wide list of chart types, including dynamically updated charts. Pre-defined fully customizable charts for monitoring the server CPU load and disk space usage, router traffic, etc.
- Grouping. Grouping and group operations are available for network devices. Groups may include devices of different manufacturers.
- Agentless Monitoring. AggreGate monitors a network without any agents, so there is no additional software or hardware to install on devices that requires monitoring.
- Distributed Monitoring. AggreGate Client software is designed to process the data coming from several servers located in different parts of a large network. Enterprises can enjoy the centralized monitoring of different branches from the IT headquarters.