Performance Monitoring
AggreGate Network Manager ensures the 360° network performance visibility required for proactive diagnosing of the host/application downtime and capacity planning. The key network performance indicators include:
| Router/switch bandwidth usage |
| Server/router CPU load and memory utilization |
| Storage space usage for servers, disk arrays, tape libraries, and other NAS devices |
| Application/service response time |
| Server uptime |
| Network links quality (latencies, jitter, packet loss rates, etc.) |
| Custom performance metrics (e.g., wireless signal strength) |
Every performance indicator is backed by numerous analysis tools, such as alerts, charts or reports. The performance metrics history is stored in a server database for long-term trending.
CPU Load Monitoring
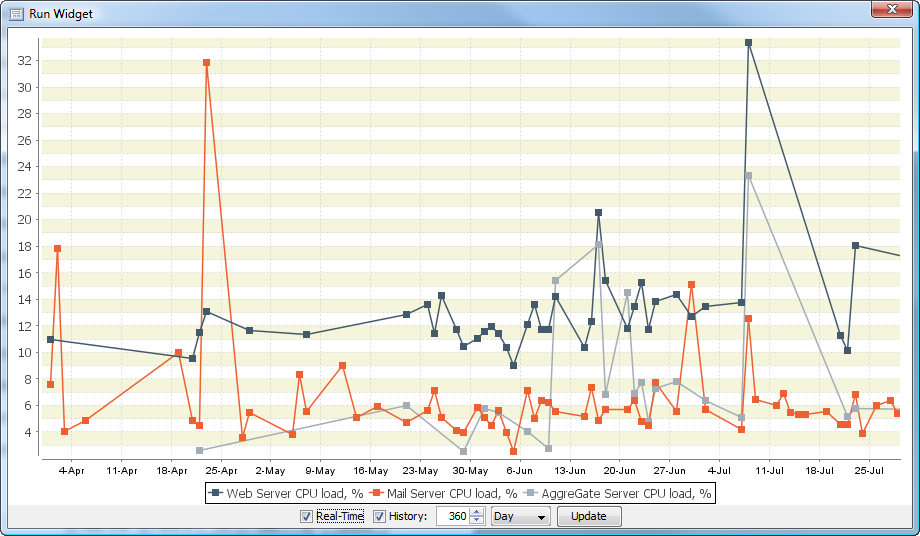
AggreGate Network Manager tracks the CPU load of your servers, routers, managed switches, and any other devices supporting CPU utilization reporting via SNMP. The utilization percentage is tracked individually for every processor or processor core.
An alert will be raised when the device's average CPU load exceeds a configurable threshold for longer than a certain time (also configurable). Alert settings, notification procedures and corrective actions may be shared between the devices or set up for every device individually.
It's also possible to track the CPU usage of individual processes running on remote machines.
Storage Space and Memory Utilization Monitoring
The disk space of your servers and NAS devices is also monitored via SNMP. AggreGate Network Manager tracks and displays the labels and free/used space for every disk, partition and filesystem. Customizable disk space and memory utilization charts are provided out-of-the-box.
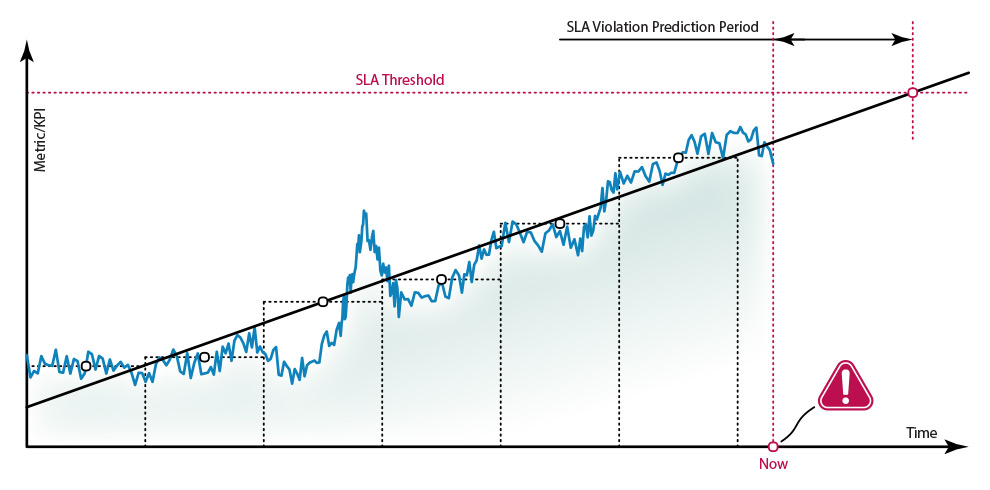
Storage space charts can be accompanied by the linear regression trends for predicting the moment of near 100% utilization.
AggreGate Network Manager can also track the absolute and relative memory usage of individual processes running on the remote servers/workstations.
Custom Performance Metrics
AggreGate Network Manager is able to collect the custom performance indicators from any networked devices via SNMP, WMI, CLI, and any other remote monitoring protocols and corresponding device drivers (Modbus, BACnet, OPC, etc.)
Here are some examples:
- Wireless signal strength (SNMP)
- Application server thread count (JMX)
- Windows Paging File Size (WMI)
AggreGate IoT Platform provides rich processing and analysis options for any custom metric. See Technology for more information.
Response Time Monitoring
The performance of a networked application may degrade due to different reasons, such as slow network link, low server memory or high CPU usage, application-specific problems. A synthetic metric mirroring the application health in a relatively correct way is its response time, e.g. a period between sending an application-specific request and receiving a full response.
Application response time examples:
- Web page load time
- SQL query execution time
- Time required for downloading a file from the remote FTP server
- Remote shell script execution time
In addition to the application response time, AggreGate Network Manager tracks the response time of all servers/workstations that is measured via the ICMP echo (ping). Combined with the packet loss rate, such ping response time measurements greatly help with detecting the network links degradation.
Bandwidth Usage Monitoring
With AggreGate Network Manager, a system administrator gets warned once the current traffic of any router/switch interface comes close to the theoretical interface speed (or other user-defined thresholds). To help catch a bandwidth hog, the Network Manager uses traffic decomposition allowing figuring out which host and application caused the traffic. Such analysis is performed via the dedicated traffic analysis protocols (e.g., NetFlow).
See Traffic Monitoring for more information.
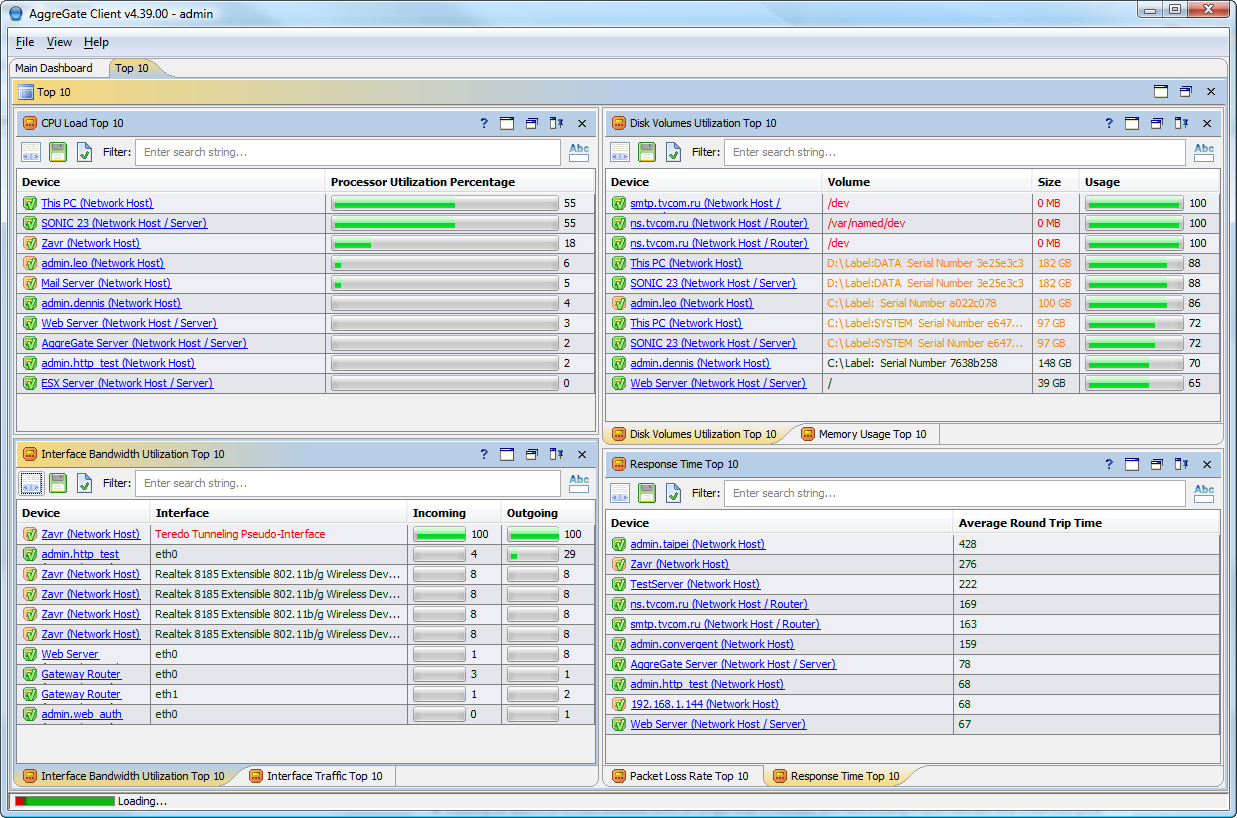
Top 10 Performance Dashboard
A system administrator's duty starts with an overview of his "empire". If everything runs smoothly, he may enjoy his job right in the morning. The Top 10 dashboard is designed to eliminate numerous checks of different network resources by combining the information about problematic and heavily loaded resources in a single place.
Performance Degradation Alerting
Advanced alerting engine provided by the AggreGate Platform solves even the most complicated performance degradation detection tasks. Here are just some examples of complex alert triggering conditions:
| Detect a DDOS attack by triggering an alert if multiple "overload" events occur within a certain timeframe |
| Raise an alert if the CPU load exceeds 80% for longer than 5 minutes and deactivate it automatically only if the load goes below 30% for more than an hour |
| Trigger an alert if more than X servers belonging to a cluster become unavailable or don't match a specific performance criteria |
| Predict the future SLA violation of a multi-component service by analyzing its KPI trend |
In addition to notification broadcasting, every alert can be followed by the forced operator acknowledgment and automatic/interactive corrective actions. For example, the Network Manager can restart a service or reboot a server upon the performance alert.