Router and Switch Monitoring

AggreGate Network Manager automates the IT administration by constantly monitoring business-critical routers, switches, access points, and base stations. It offers an extended support and integration for popular hardware vendors, such as Cisco, HP, Alcatel, Juniper, Brocade, Ericsson, Huawei, D-Link, Zyxel, and others.
Furthermore, the Network Manager provides an industry-leading support for custom SNMP implementations that use private enterprise MIB structures.
Traffic/Bandwidth Monitoring
AggreGate collects the real-time traffic and bandwidth usage percentage metrics from individual router/switch ports. This provides some spot and historical insights on the router/switch health and communications with its peers.
The Network Manager is optimized to keep and quickly access the long-term trends for thousands of network interfaces, which helps to build the averaged charts for hourly, daily, weekly, monthly, and yearly traffic/bandwidth usage.
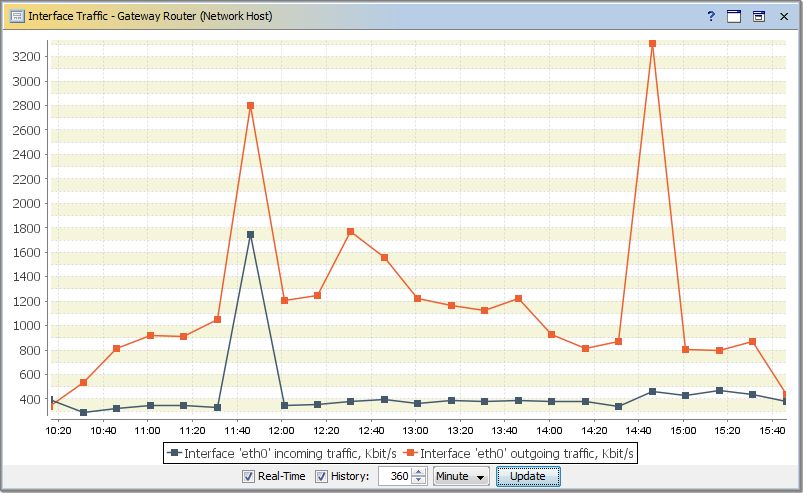
Unlike similar platforms, the AggreGate Network Manager's architecture provides fully customizable charts and reports. It's possible to combine the traffic from several ports and even devices on a single chart, add the moving average or linear regression trends to facilitate the capacity planning, and more.
Scheduled Traffic Reporting
Traffic and bandwidth usage reports can be scheduled for periodic emailing to a system administrator or other people in charge. Reports may be sent in PDF, HTML, RFT, Excel, and other formats.
High Bandwidth Utilization Alerts
AggreGate Network Manager will trigger an alert if the interface's bandwidth utilization percentage exceeds a certain threshold. The alert notifications can be delivered via email, SMS and other methods.
Traffic Decomposition and Analysis
In addition to retrieving simple per-port traffic metrics via SNMP, AggreGate Network Manager can collect and process the traffic data using NetFlow, sFlow, and IPFIX.

Interface Status Monitoring
Every managed switch and router provides real-time information about the status of its network interfaces via SNMP. The Network Manager collects the port/interface status information from monitored devices to provide the per-device and global port status reports.
When a network interface goes down for some reason, one of the following alerts is generated:
- Shutdown (mostly due to a transport network failure)
- Administrative Shutdown (result of a human operation)
Other Performance Metrics
All standard router health and performance metrics are collected by default, including availability, response time, CPU load, memory usage, fan speed, etc. A lot of tools are provided for analyzing these metrics:
- Alerts (e.g., Link Down, Router Configuration Changed, EGP Neighbor Lost)
- Reports (e.g., Interface Traffic Top 10, Memory Usage Over 90%)
- Charts (e.g., Interfaces By Type, Response Time Top 10)
Moreover, AggreGate IoT Platform provides a unique functionality for setting up alerting, querying, reporting and charting on the custom performance indicators (such as WiMAX signal strength).

Router/Switch Discovery and Mapping
A network discovery process finds all routers and switches in the scanned network, creates the device accounts for them and applies the optimal monitoring profiles for all ports/interfaces.
If the discovered routers are later added to a dynamic network map, each device is accompanied by several mission-critical metrics shown on the map right next to the device image.
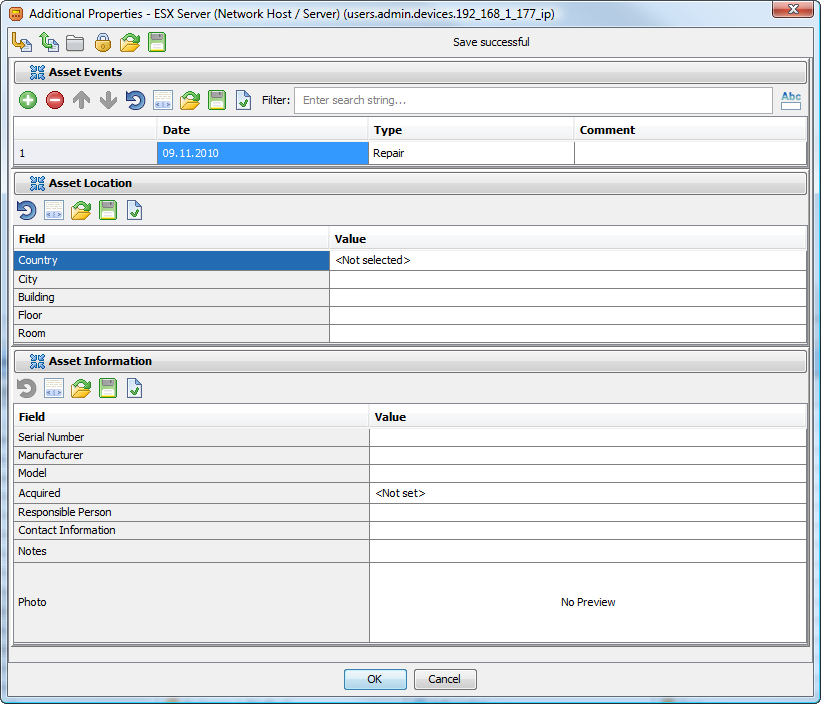
Custom Asset Information
AggreGate Network Manager is a very flexible IT asset tracking solution. In addition to specifying the pre-defined asset tracking data (serial number, model, location, notes, etc.), it's possible to associate the custom data in a user-defined format with every router, switch or other IT asset.
Rare Equipment Support
Some network devices provide more detailed and precise versions of the "standard" metrics (CPU load, fan speed, etc.) via non-standard SNMP MIBs. These metrics are directly supported by the built-in alerts, reports, charts, and other data processing facilities.
For example, such alerts include:

Fan Notification

Temperature Notification

Device Shutdown

Redundant Power Supply Notification

Voltage Notification