Apache Monitoring

Apache HTTP server traditionally serves billions of web pages worldwide. Both SMBs and large corporations use it as a strong foundation for their web infrastructure.
AggreGate Network Manager provides the in-depth Apache server availability, response time and performance monitoring. The Apache monitoring dashboard provides statistical information for the following Apache-specific KPIs:
| Server name | Server version |
| Listened ports | Uptime |
| Total traffic | Total served pages |
| Busy processes | Idle processes |
| Number of requests per second | Current traffic |
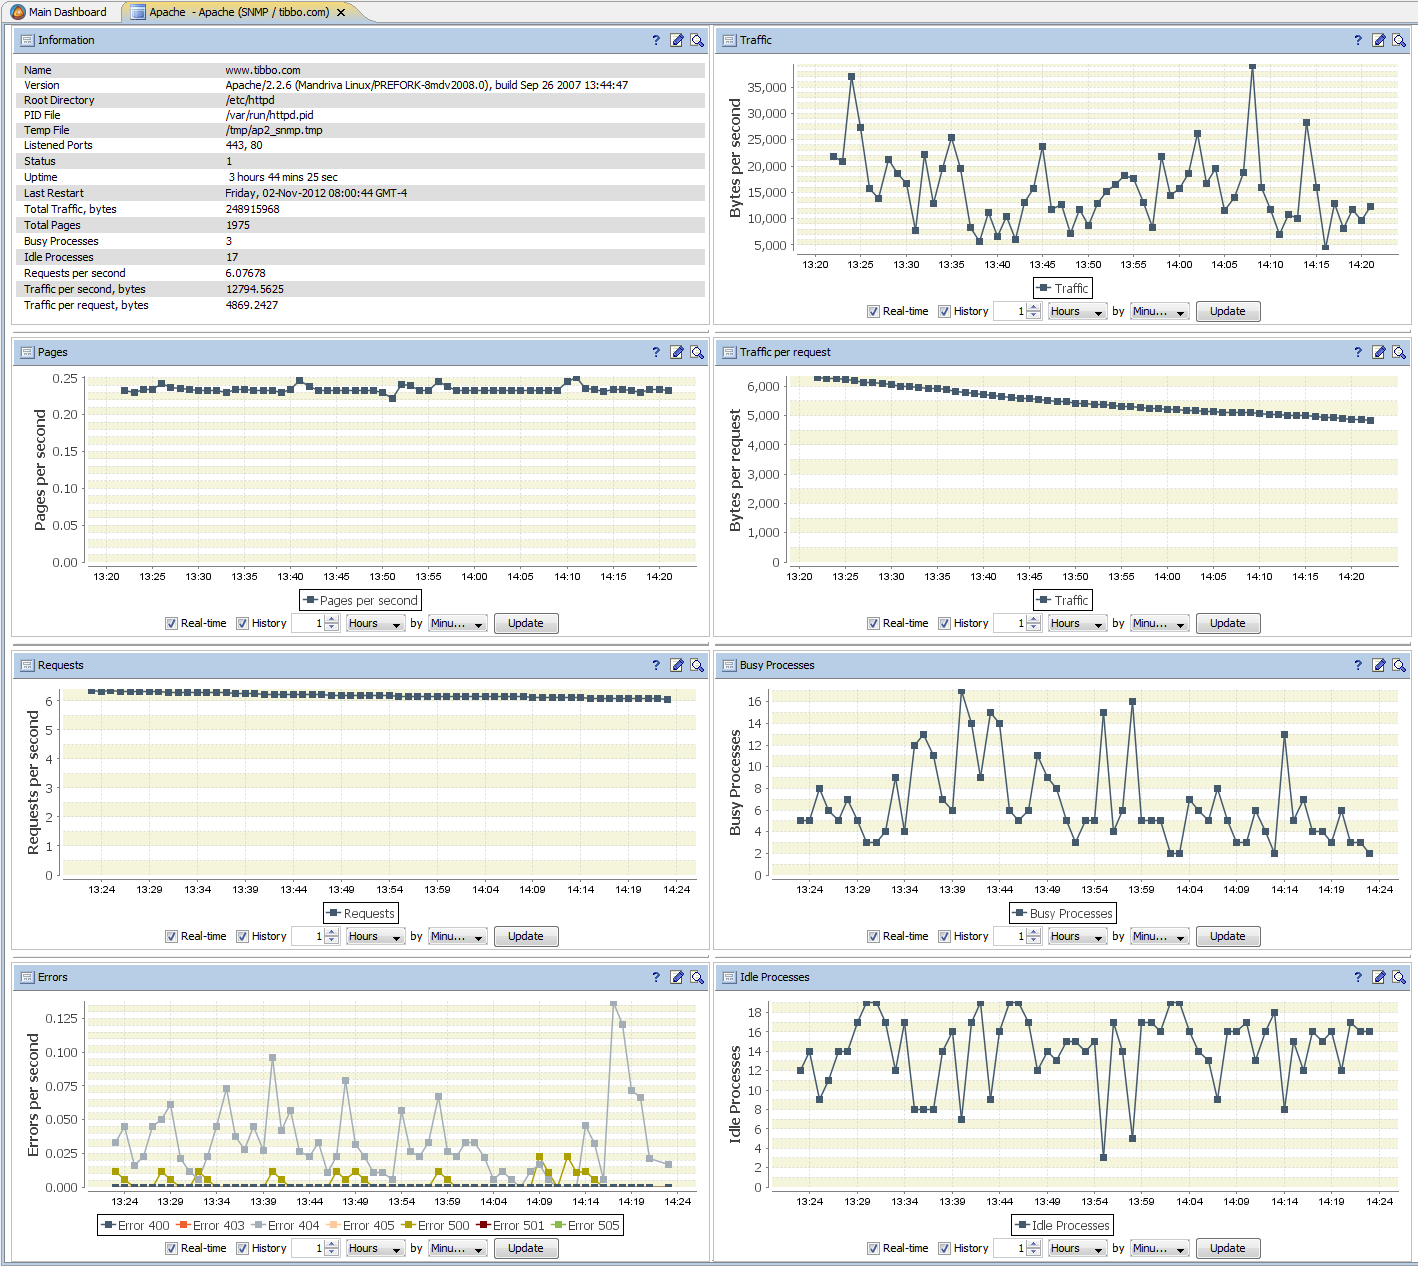
Most of the above metrics are available as spot values and trends. Additionally, the Apache monitoring dashboard renders detailed statistics for the following HTTP errors:
- Bad Request
HTTP code 400 - Forbidden
HTTP code 403 - Not Found
HTTP code 404 - Method Not Allowed
HTTP code 405 - Internal Server Error
HTTP code 500 - Not Implemented
HTTP code 501 - HTTP Version Not Supported
HTTP code 505
Website Monitoring
In addition to tracking the Apache-specific parameters, the Network Manager offers a full range of generic web server and website monitoring features:
- Web server response time monitoring
- Monitoring of individual virtual hosts (sites) configured on a web server
- Monitoring of SOAP-based Web Services
- Remote web server log analysis and alerting upon the occurrence of specific error patterns
- Receiving the web server errors via Syslog and Windows Event Log
- Consolidated status of servers participating in a failover or load balancing cluster
- Multiple servers of a distributed AggreGate installation will "see" a single site from different locations
- Comprehensive monitoring of the underlying application servers and database engines
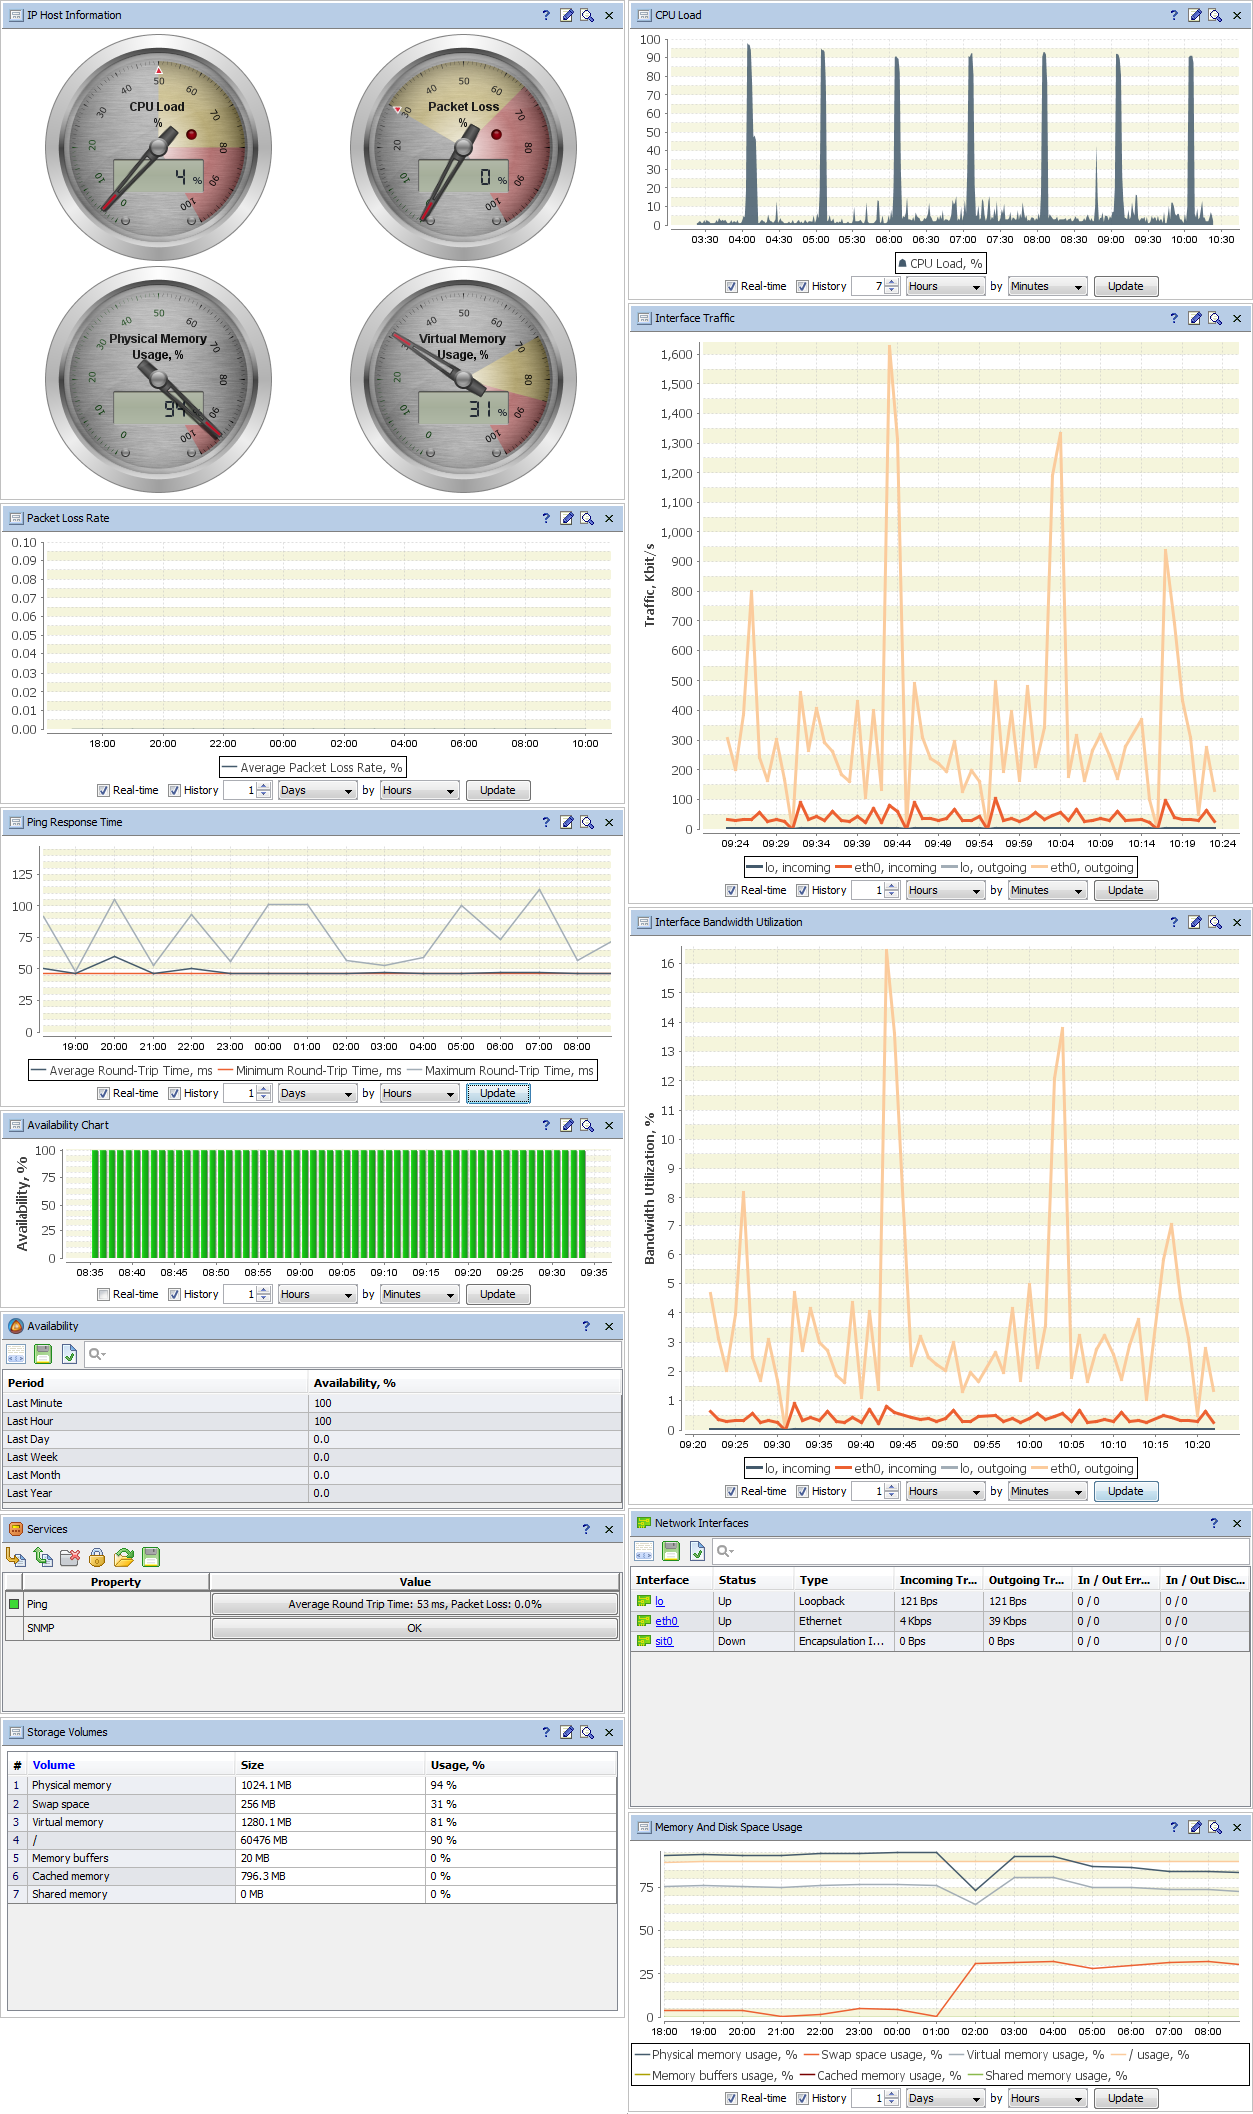
- Monitoring the CPU load, memory, bandwidth usage and other KPIs of web server machines
- Auto-disabling monitoring during the scheduled maintenance periods
- Out-of-the-box threshold violation alerting
- Comprehensive management reports on the website metrics history and trends
- Hourly/daily/weekly/monthly/yearly downtime percentage statistics
- Dashboards, graphs and charts visualizing the web server status
See Web Server and Website Monitoring for details.
User Perspective Monitoring
The Network Manager also provides the advanced web page content tracking opportunities:
| Web page load time tracking and threshold alerting | Simulation of different User Agents and customization of other HTTP request headers |
| User perspective monitoring of regular HTTP and HTTPS URLs, including the ones that are protected by realm authorization or require client certificates | Modeling and business rule engines for the dynamic web page content validation and analysis |
| Support for HTTP redirects | Web page change tracking and alerting |
| Form submission via the specification of HTTP GET and POST parameters in URL requests | Validating operability of the underlying scripts and a database engine |