Application and Service Monitoring
AggreGate Network Manager helps the companies ensure high availability and performance of their business applications. The system "knows" common applications, services, technologies, protocols, and uses the intelligent monitoring technology for checking operability of the business-critical systems.
In addition to native monitoring of the networked applications, AggreGate Network Manager obtains the information about processes running on the remote machines via SNMP. This allows to configure alerting, charting, reporting, and other processing for:
| Process instance count |
| Per-process CPU load |
| Per-process memory usage |
AggreGate Network Manager supports the batch configuration of application monitors for several hosts, along with the replication and export/import of monitoring settings.
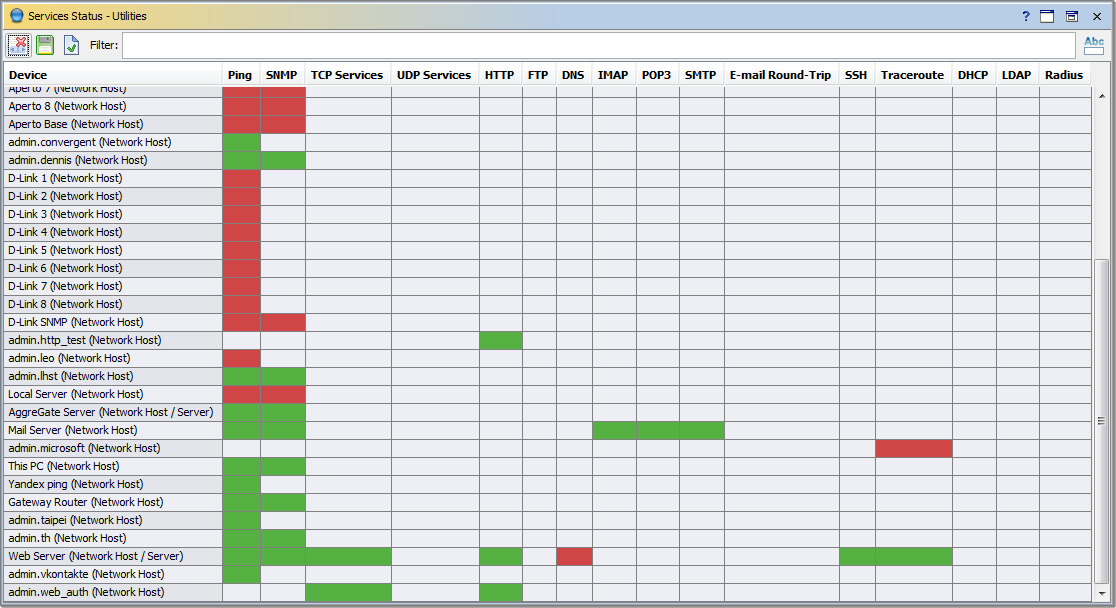
Service Status Dashboards
Service status dashboard provides a very easy way to get an overall picture of your IT infrastructure health. It shows a matrix of servers and services, indicating the state of every service by color-coding. The service status dashboard is a nodal point for finding the root cause of diverse network problems.

Application Problem Alerting
AggreGate Network Manager provides the out-of-the-box alerts for typical application problems, such as Apache Web Server Requests Overload or FTP Out Of Disk Space.
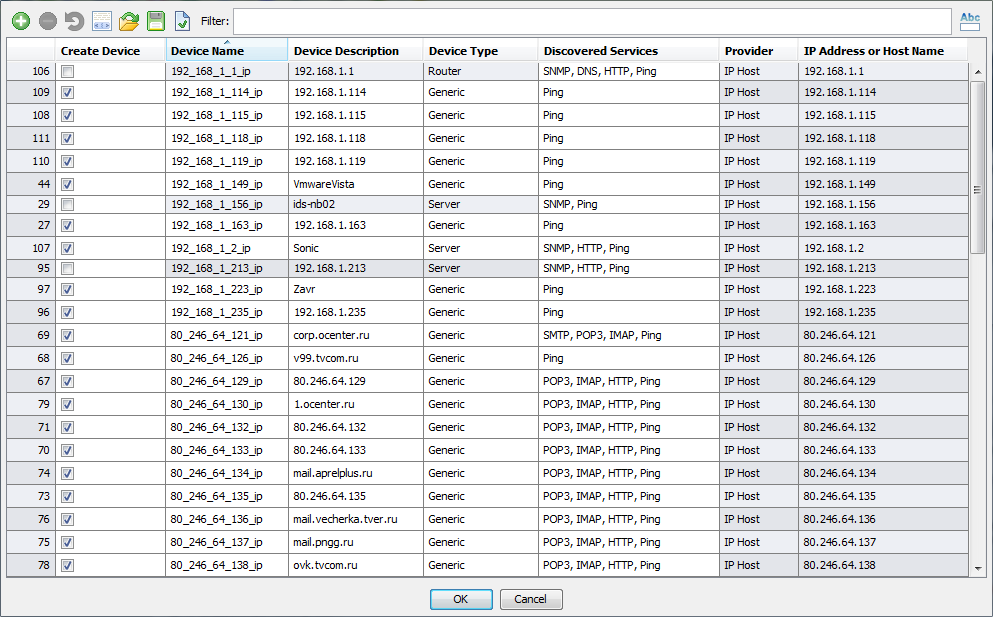
Application/Service Discovery
The network discovery process finds both known and unrecognized ("generic") services by TCP/UDP port scanning. If an active service is detected, its monitoring is auto-enabled when a device account is created for the host. The system also finds and applies an optimal monitoring profile for every service.

Message and Error Aggregation
The Network Manager remotely collects application messages and error notifications via the Syslog and Windows Event Log facilities. These messages are stored in the central server database for maintaining the long-term audit trails.
Received application errors can be broadcasted using the Syslog and SNMP traps. Any application error can trigger an alert, causing the email/SMS system administrator notifications and automatic corrective actions (server rebooting, remote script execution, etc.)
Web Server and Website Monitoring
Round-the-clock supervising of your website is crucial for the proactive identification of problems before they escalate into the substantial downtime and lost revenue.
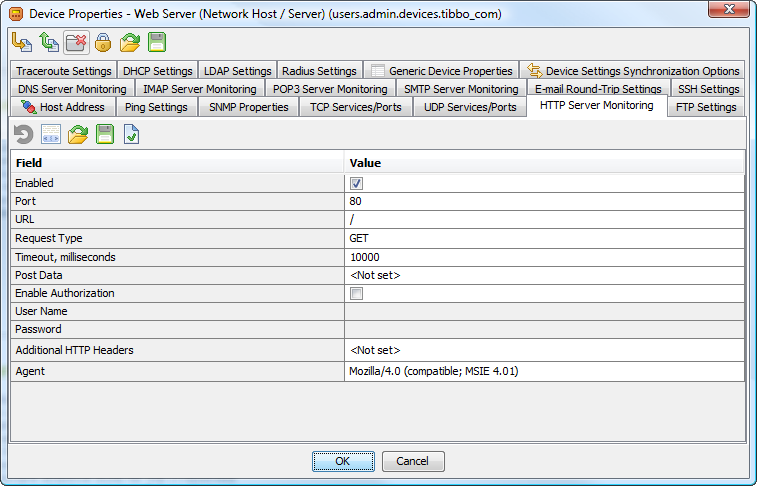
Monitoring of the web servers, including Apache and IIS, is performed by:
| Ensuring the server availability |
| Passing the web authorization if necessary |
| Requesting the certain URLs via HTTP and checking the response codes |
| Injecting the web pages content into the system core for deep analysis (e.g., keyword search) |
| Measuring the response time |
The system also provides comprehensive information about the web server health by alerting (e.g., Traffic Overload Alert) and charting (e.g., Apache Busy Processes Chart).
Mail Server Monitoring
In the today's Internet economy, any business just hangs if a corporate mail server is down or faulty. AggreGate Network Manager is designed to prevent the mail system downtime by:
- Checking the message availability (POP3/IMAP folder checking)
- Checking the outgoing mail server operability (SMTP authorization)
- End-to-end delivery verification (E-mail round trips)
Generic TCP/UDP Port Monitoring
Operability of the network applications and services (both TCP and UDP) that are not natively supported is ensured by:
- Establishing a connection with a service (for TCP-based services) and checking its availability
- Sending some raw input data
- Reading the raw output and injecting it into the system core for analysis
- Measuring the response time and storing its stats
Database Monitoring
AggreGate Network Manager monitors the database servers via JDBC/ODBC. Most modern enterprise databases are supported, including Oracle, Microsoft SQL Server, MySQL, PostgreSQL, Firebird, etc.
The Network Manager checks the server availability, executes the custom queries and matches the query results against a specific criteria (field/row count, field values, etc.)
Java and .NET Application Monitoring
The Manager acts as a JMX-based monitoring tool, providing the end-to-end management for any Java-based applications and application servers.
Similarly, a comprehensive .NET application monitoring and management are enabled via the WMI protocol.
Other Services
There are many other "smart" application monitors bundled with the AggreGate Network Manager. Here is a brief summary of their functionality:

| FTP Server monitor: checking the remote files and folders |
| SSH Server monitor: authorizing, executing the remote shell scripts and validating their output |
| DNS Server monitor: ensuring that the DNS zone contains valid information |
| DHCP Server monitor: verifying the server operability by the IP address leasing |
| LDAP Server monitor: executing the search queries and analyzing the results |
| Radius Server monitor: passing the authentication procedure |