 Release
6.3
Take your business to the next level with cutting-edge digital enterprise management solutions
Get AggreGate IoT Platform 6.3
Grant Seamless Access to Applications with Single Sign-On
Elevate the accessibility and security of your applications with Web Single
Single
OAuth, a widely adopted security protocol, is at the core of this implementation. It securely grants access to resources on behalf of users without exposing sensitive credentials.
Configurable External Identity Providers.
External identity providers like Google Identity and Access Management, Azure Active Directory, and others can be configured to streamline authentication.
Straightforward Configuration.
Setting up external authorization is made simple with detailed instructions for popular identity providers. Step-by-step guides ensures a smooth setup process.
Enhanced Security.
Enables external authentication while giving control over which users can access your applications.
Implement Complex Automation Logic with Drag-and-Drop Simplicity
The new web editor for Workflows allows users to implement complex automation logic easily, using a
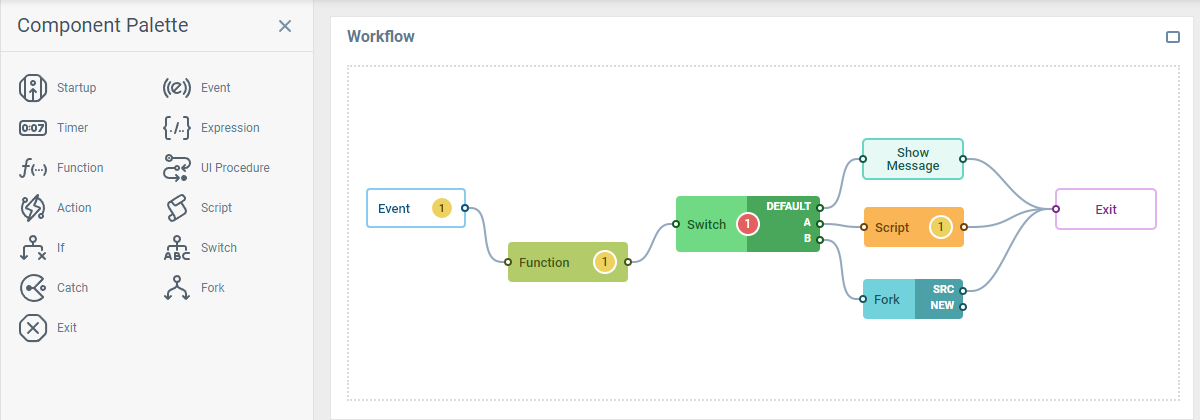
Workflows can be designed as interactive actions, which can be used to guide users through a series of steps, collecting their input and choices as needed. For instance, a workflow could be activated by a fire alert, which could guide the operator through a sequence of actions, such as examining video feeds, making calls, and shutting down certain equipment. For tasks which don’t require user interaction, workflows can be created to run autonomously, implementing the indicated logic and interacting with the system as needed.
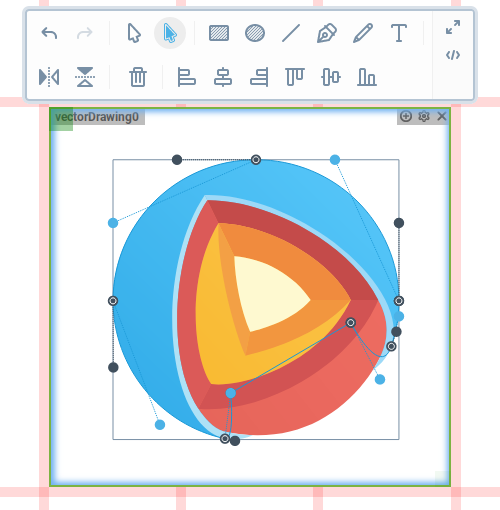
Design HMI Symbols in the Web-based Vector Image Editor
The latest Web UI builder version now features a built-in SVG editor. It allows you to create custom SVG visuals right within the Web UI builder, reducing or even eliminating the need for external editors. Streamline workflows and speed up design iterations, whether you're creating intricate HMIs or a few custom icons.
Position Your Components within Multi-level Dashboard Layouts
Managing new component locations within dashboards just got easier. Now, components that trigger actions can seamlessly place the resulting UI elements into specific containers, even within a complex, nested dashboard hierarchy. This means you have finer control over the visual organization of your dashboard, making it straightforward to design complex user interfaces that adapt dynamically to user interactions. Whether you're creating a data-driven dashboard or a multi-step application, this update empowers you to craft more intuitive and user-friendly interfaces while maintaining complete control over component placement.
Use Flexible System Tree Filtering
The System Tree Component now incorporates the Node Validity Expression. This feature enhances the way in which contexts from the server are displayed, providing refined control over exactly what is shown.
Node validity allows for adaptable updates based on user actions or server events, ensuring only relevant and useful contexts are presented to the user. This allows for the creation of much more personalized and streamlined experiences, with developers being able to adjust what is seen according to specific use cases and actions.
Unify Search Results across Distributed Installations and External Sources
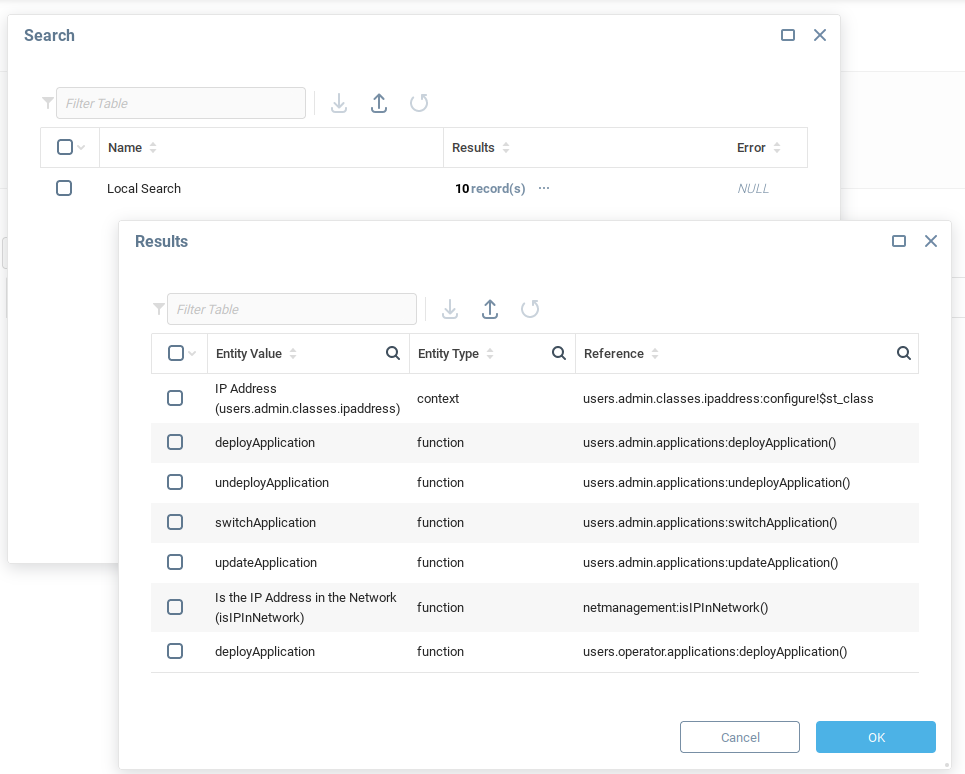
The newly integrated search system allows you to simultaneously query any number of sources and process the results from a single context. Include search results from databases, static files, APIs, basically any resource available to your app. Give users the ability to search for specific items from several different servers, aiding in the discovery of contexts, variables, event instances, and more.
Fine-grained control over what server content is indexed ensures that server resources are used efficiently, while still providing accurate search results. Let your users find the exact content they need, even in distributed environments with large numbers of servers. Search results are easily available to be used in Web UI components, in order to build custom search result pages.
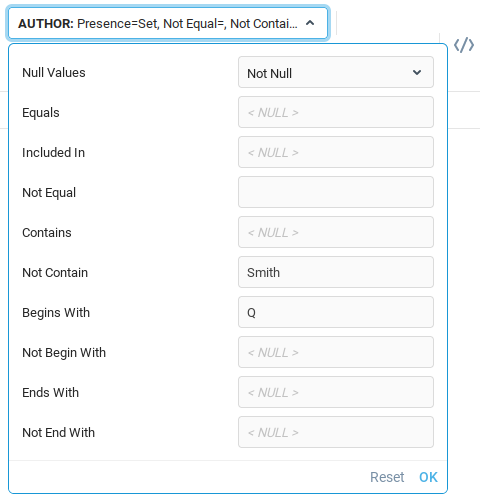
Deep Dive into Tabular Data with New Smart Filters
Significant enhancements have been introduced to the filtering capabilities of "table-based" Data Table Editor, Class Instance List, Event Log and the new Context List components. These improvements are based on the implementation of new smart filtering options which simplify the exploration and analysis of tabular data. Users can now effortlessly create and customize filters to display specific contexts, including those matching complex container masks, providing a more tailored view of the data.
Filters automatically update in response to context creation, removal, or updates, ensuring access to the most up-to-date information. Intuitive options for selecting displayed variables, reordering columns, and accessing actions associated with listed contexts have been provided, laying the foundation for more versatile and efficient data exploration.
Fundamental Statistics Functions Implemented in the Expression Language
The latest release brings a variety of mathematical functions for the Expression Language to simplify data analysis and interpretation.
Functions for determining the Maximum, Minimum, Sum, Average, Median, and Mode from an arbitrary field of a data table are now available. More complex capabilities including multi-modal Frequency, Standard Deviation, Standard Error of Mean, Dispersion, as well as Simple Moving Average have also been added. Finally, use the new Linear Regression function on two fields of a data table to get a quick understanding of their relationship. The addition of these fundamental functions should simplify the task of building expressions to analyze and process numerical datasets.
Import and Export Complex Applications via a One-click Operation
The Applications module has received significant enhancements aimed at simplifying the process of exporting and importing applications, helping you streamline the resource management pipeline. Users still have the capability to create comprehensive packages encompassing a wide array of resources, including alerts, dashboards, models, and various configurations. These versatile packages can be distributed through either a store or a version control system, facilitating collaboration among engineers during application development.
Users can readily export applications in the form of plugins or disk folders, allowing for versioning and change management. The refined data import/export functionality not only simplifies the packaging and management of resources, but also ensures that deployments, updates, and rollbacks of applications can be done reliably and predictably.
Better Control Your Devices and Resources with the New Context List Component
Bring the convenience of specific context lists right to your user interface. Show the exact subset of contexts your users need to interact with based off a context mask. Displayed contexts automatically update, ensuring you're always viewing the most current data after any context creation, removal, or alteration.
Users can access selected variables, fields and actions for each listed context without having to navigate away from the component. Furthermore, the user can drill down beyond the context mask with an array of filtering options that allow for highly customized viewing.
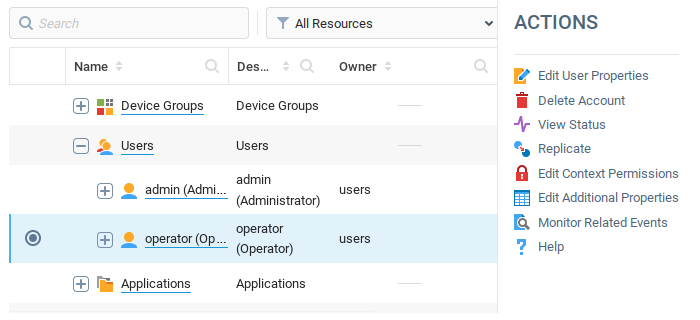
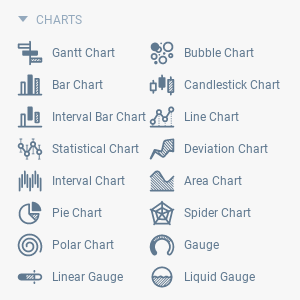
Leverage Greatly Expanded Chart and Diagram Component Family
Check out the wide range of new chart components that can be utilized in the Web UI builder. These additions enable effortless representation of various data types – from project timelines with Gantt Charts or financial data with Candlestick Charts. These new components provide greater coverage for your charting needs, enabling you to express diverse data types more effectively.
Whether you're harnessing the Liquid Gauge Chart to display changing fluid levels, exploring the Bubble Chart for interactive data clustering, or utilizing the Deviation Chart to spot anomalies, the expanded charting capabilities ensure you have the tools required to craft compelling and insightful interfaces.
Build your own Web UI Components with React
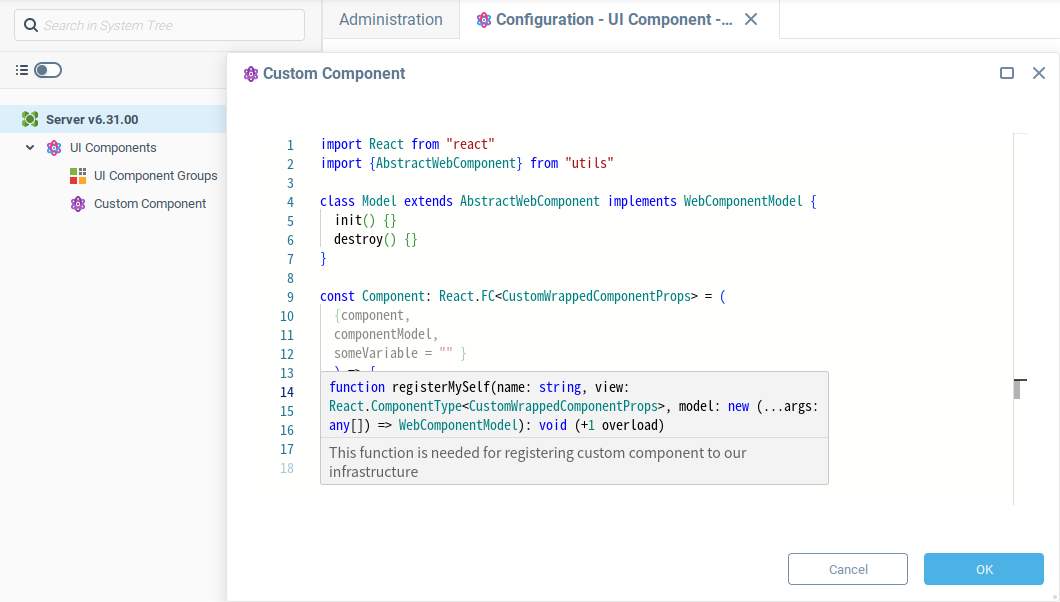
Sometimes your unique use cases may require more than what pre-built Web UI components offer. You are now able to use one of the most widely adopted JavaScript libraries, React, to build bespoke Web UI components. The active open-source community is constantly creating and sharing new React components, which can easily be incorporated into your custom components.
Custom Web UI components can seamlessly integrate with the platform, offering support for events, functions, variables, and more. Once a component is developed, it can be used just like any other dashboard component, leveraging the full power of the expression language and bindings to create the precise user experience your product deserves.
Efficiently Extend Existing Classes with Inheritance
Introducing class inheritance, allowing you to efficiently manage complex subcategories, by extending existing classes. Now, when creating a subclass, there are improvements under the hood: the subclass table now contains only the fields introduced by the subclass itself, while the inherited fields are neatly organized in the corresponding superclass table. Data integrity and accessibility is maintained by linking between subclass and parent tables in hidden fields, allowing you to focus on only the fields relevant to your classes.
When updating or inserting new instances, the system organizes columns and updates or inserts them accordingly across tables in the hierarchy. You can now utilize base class tables to view subclass instances. This enables you to put both a superclass and subclass on one dashboard for efficient viewing of subclasses instances via their respective superclass' fields.
Ensure Uninterrupted Service with Active-Active Failover Capability
This advanced configuration maintains seamless operation by utilizing multiple servers, guaranteeing uninterrupted service for critical operations. In the event of primary server failure, the backup servers take over in mere seconds, maintaining data continuity.
Active-active cluster coordinator monitors all servers and maintains resource registries, enabling "anti-crisis" resource management during unforeseen outages. With active-active clustering, your mission-critical industrial automation servers are protected, ensuring smooth business operations, regardless of challenges.
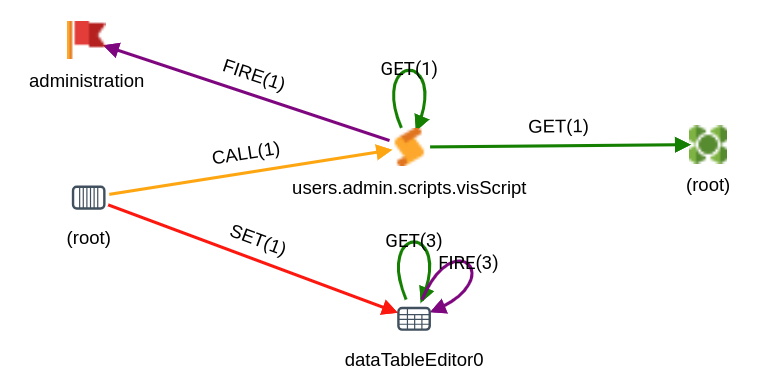
Explore the Low-code Application Structure with Topology Visualization Feature
Application structure discovery is a groundbreaking tool that empowers users to explore the intricate relationships between contexts and entities within their app and visualize their topology. Gain deep insights into the structure of low-code applications, without the need to delve into every individual binding and property. Different levels of detail display everything from an overview of an application's architecture, to exploring the references of a single binding.
Whether a seasoned developer is troubleshooting a complex issue or a beginning low-coder is just trying to understand an application's structure, the topology discovery provides a valuable tool to enhance your understanding of AggreGate-based product, service or solution. Dive into this exciting feature and gain a new perspective on your applications.
Configure Time Series Aggregation with a Step-by-Step Wizard
Introducing effortless data channel detection for your charts. Now, your charts can automatically incorporate statistics and granules into your data sets, simplifying chart development and improving accuracy.

When you configure your chart with the "Use Aggregated Data" option set to Statistics, Granulations, or Both, the chart smartly assesses the available statistics and granules based on key parameters like Context, Variable, Expression, Timestamp Expression, Aggregation, and Type. It first checks for an exact match, but if no exact match is identified, the system intelligently seeks out statistics or granules with a finer level of aggregation. And in cases where no matching statistics or granules are found, your chart still seamlessly draws from raw history data. To enable this automatic detection, simply set the Data Source Type of your chart to Variable and configure the Source Variables property to align with the relevant statistics or granules. This breakthrough feature simplifies data integration, saving you time and ensuring your charts are always powered by the most relevant and accurate information.
Use Multiple Event Storage Facilities on a Single AggreGate Server
A new degree of flexibility for event storage is now available. This update allows you to use different Data Access Objects (DAOs) to store events. This enhancement simplifies the management of historical events by automatically creating, deleting and configuring event storages based on server configuration properties. It eliminates the need for manual creation or modification of event storages in most cases. For complex systems, there is enough versatility to allow events that require further relational-style query-based loading to be stored in a relational database, while all events can be stored in a NoSQL database.
Centralize License Control for Distributed Installations
The License Server plugin has been updated to include new functionality that streamlines license management. This is particularly useful for organizations with a large number of servers. It offers an efficient way to centralize and monitor all server licenses from a single location, providing insights into license distribution, user roles, maximum active servers per license, included plugins, leased servers, and more.
