Event Management

In AggreGate, internal server activities, valuable operations of plugins, asynchronous notifications received from devices, system operator actions and even value changes are represented as events.
Event management is a technology for making sense of a large number of events and pinpointing a few ones that are really important. AggreGate servers process billions of events received from diverse sources and generated within the system, but only a few of them are manually analyzed by system operators and administrators.
Event Flow
The platform offers advanced event management tools that all together allow implementing complex strategies involving real-time monitoring, filtering, aggregation, masking, acknowledgment, enrichment, correlation, and root cause analysis.

Real-Time Monitoring
Monitoring valuable events in real-time is a typical activity of system operators in automation, physical security, fleet management, and many other verticals.
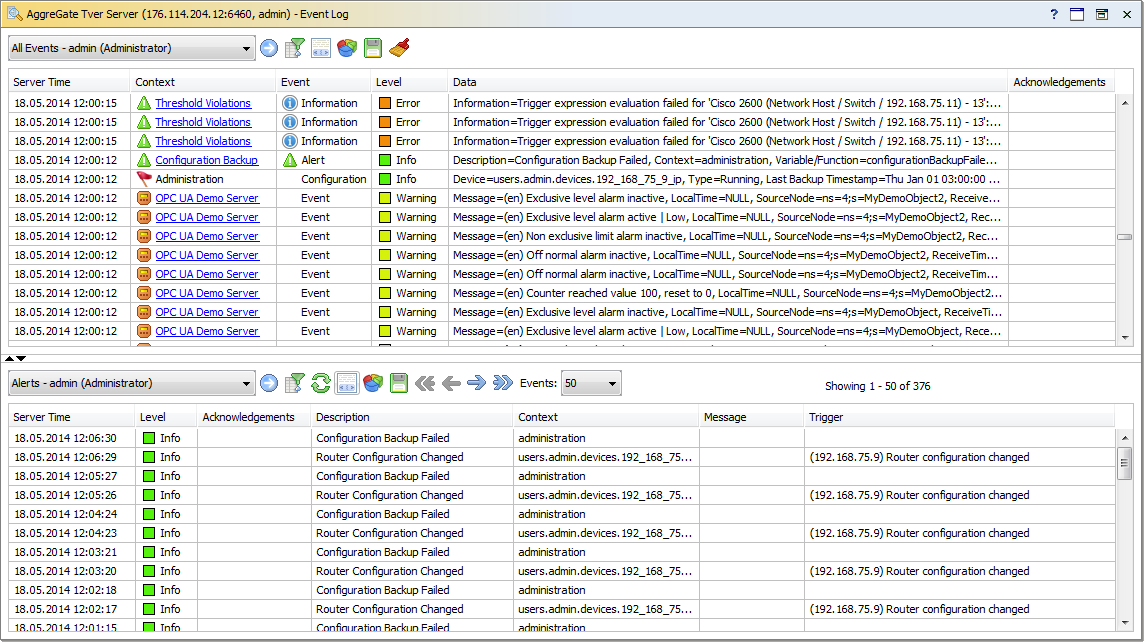
Events are subdivided into several severity levels, including notices, information events, warning, error and fatal errors. The essential tool for event monitoring is event log available in all types of AggreGate user interface. The log is divided into two areas: Real-Time Events and Event History. The log provides event sorting, filtering, deleting, acknowledging, and a way of accessing event-related actions.
There are two types of events: transient and persistent events. Transient events can be only processed (for example, trigger an alert) at the moment they are generated. Persistent events are stored in the server database, and therefore can be used for trend analysis, charting, report building, etc. All persistent events are automatically purged after a configurable expiration period.
Event Filtering
Highly loaded AggreGate servers process millions of events per hour. To mark out essential events from the incoming event stream, AggreGate users can create and manage event filters. A filter is owned by whoever created it but may be shared between users due to a flexible permission setup.
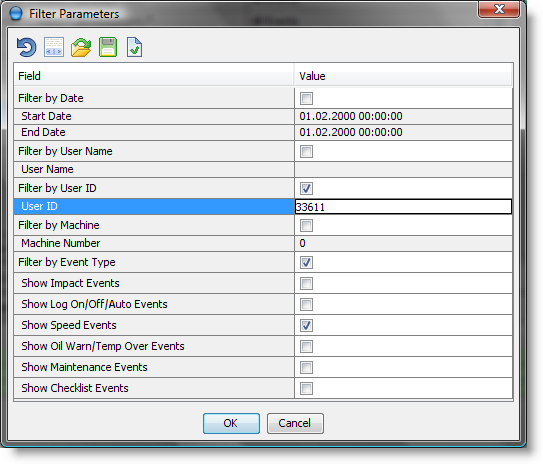
Events can be filtered by source (device, a group of devices, system resource or a group of resources), event type, event severity level, parameters of acknowledgment/enrichment or any custom criteria defined by the expression.
Filtering by an expression makes event filters extremely flexible. Here are just some examples of how it may help:
- Finding events fired within a specific date/time range
- Finding Login events of a particular user (i.e., filtering by username)
- Finding all events that contain a specific substring in any of their data fields
- Finding all temperature readings collected when the temperature was higher than 120 degrees
- Filtering events matching condition X and/or condition Y, or more complex combinations
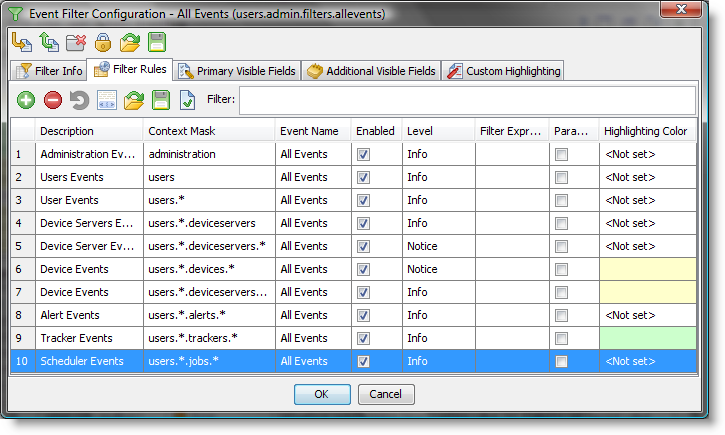
In addition to the selection criteria, the filters include event list visualization rules:
- Visibility of event's basic parameters, i.e. source, type, level, and acknowledgments
- Visibility of individual event-specific fields
- Custom expression-based and level-based highlighting rules
A filter can be parameterized to prompt an operator to fine-tune event selection criteria every time it is activated.
AggreGate-based vertical market products include sets of built-in filters for viewing industry-specific system events, device events, alerts, etc.
Beside UI-level filters, each server has pre-filtering rules allowing discarding certain events before they are saved in the database or routed to any destination.
Event Aggregation
Aggregation, also called event deduplication or reduction, allows the system to minimize the overall number of processed events by joining instances that appear to be similar according to the user-selected criteria.
For example, if multiple login attempts from a specific user have failed due to an incorrect password, this can be reflected by a single “authentication failed” event that includes several duplicates.
Event Correlation
Correlation engine finds simple relations between similar events, usually one of them marking an outset of a certain process or state, and the second one marking its termination.
Another case is a sequence of correlated events coming from different sources that should trigger a more valuable internal event.
For example, if the “perimeter security sensor activated” event from a telecom tower is followed by the “low fuel level” event, it’s quite clear that the “Fuel Theft” alert should be raised.
Event Masking
Masking means ignoring events that come from sources depending on system elements that are deemed to fail.
An example would be suppressing the “device not available” events coming from devices in case the server’s network connectivity is damaged. This will effectively prevent an event storm.
Root Cause Analysis
This is the most advanced stage of the event management process. It involves analyzing relations between events and their environment followed by finding a cause of each event.
Root cause analysis is enabled by the proper use of all event management tools provided by the platform.
Event Acknowledgment
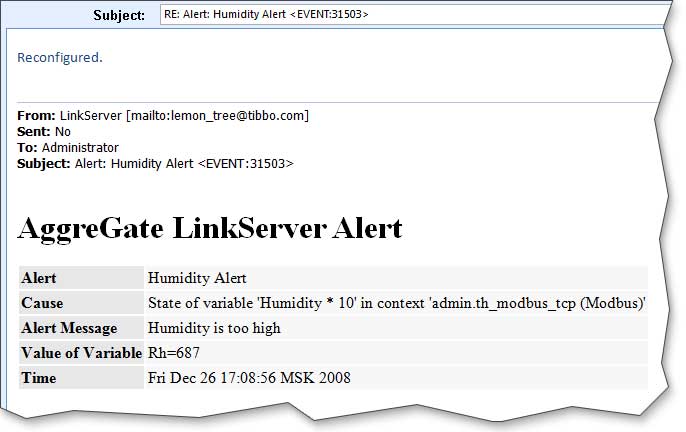
AggreGate events and alerts may be acknowledged – explicitly accepted by system operators. This is usually not a must. However, some events may be configured to require an acknowledgment.
An event may be acknowledged:
- From the Event Log
- By E-mail or SMS
- From an alert popup dialog
Every event may be acknowledged multiple times, even by different operators. The server keeps track of all acknowledgments.
If an event was supposed to be acknowledged but did not get acknowledged, its severity level may escalate.
Event Enrichment
Enrichment process is similar to automatic acknowledgment that assumes pulling external information and attaching it to every event instance.
For example, an alert event may be enriched with a helpdesk trouble ticket number.
Event Queuing
Once a new event was staged through the basic processing workflow, it gets to the dispatching phase that may look different:
- Synchronous events are handled by listeners in the same thread that produced them
- Regular sequential events are appended to the main event queue and later processed in the event dispatcher thread
- Concurrent events go through type-specific queues and their processing is parallelized in a dedicated thread pool